A chance re-encounter
A 2019 article I came across this week dragged me back into blog posting after a month-long break (sorry, fans — I have no excuse). I remember seeing the paper at the time but blew it off as mere confirmation of previous publications. But it actually may provide a way to diagnose PSP years before symptoms appear.
The problem is a familiar one
As you know from my constant harping on the subject, what we really need are two things: a way to diagnose PSP in its earliest stages, preferably before it causes any disabling symptoms (or any symptoms at all); and a way to prevent the disease process from progressing further than that. In official lingo: a marker and neuroprotection.
All sorts of marker proposals are showing promise: leading the pack right now are tests of blood or spinal fluid for neurofilament light chain or tau, PET scans for tau, and various MRI techniques. Two of the more distant contenders are smartphone-based eye movement measurements and skin biopsies for tau aggregates. The problem is to differentiate very early PSP from normal aging and from competing diagnostic possibilities such as Parkinson’s, MSA and dementia with Lewy bodies.
Get out your rulers
MRI measurements of the volume of the cerebrum is a very sensitive way to track the progression of PSP and is used in drug trials routinely to compare the rate of brain loss in the treatment group to that in the placebo group. But it doesn’t work for diagnosing the disease in the first place. For that, you need to image a part of the brain that, unlike the cerebrum, is involved early in the course of the disease. It also has to be easy to image using standard MRI machines. The dorsal midbrain does both.
As an internal comparator, the study also measured the size of the pons, which is the segment of brainstem just below the midbrain. It atrophies little in PSP. For both measures, they used the area in square centimeters of the structure on a mid-sagittal MRI cut (one that slices the head perfectly into left and right halves). See the image below.

Now, while the dorsal midbrain is where vertical eye movement, the hallmark of PSP, is situated, it’s not where PSP starts. That happens in subthalamic nucleus, the globus pallidus and the substantia nigra. But the dorsal midbrain gets involved soon enough, is much easier to image than those things, and is consistently involved in the classic form of PSP, Richardson syndrome.
History is not bunk
So, with that as background, Dr. Jong Hyeon Ahn and colleagues from six university hospitals in South Korea found 27 patients with PSP with brain MRIs not only after their PSP symptoms began, but also before they began. The scans had been performed for non-PSP symptoms such as transient dizziness, fainting, suspected stroke, or headache. In fact, the article says that elderly South Koreans often request — and receive — brain MRIs as part of their routine checkups. (Who knew?) The MRIs were routine, with none of the standardization across radiology sites that are commonplace in multi-center drug studies. In other words, these were “real world” MRIs.
The pre-symptomatic MRIs were performed an average of 28 months (range: 12-48 months) before PSP symptoms began and the researchers pored over their records to make sure there were no symptoms at the time suggestive of PSP. They rejected MRIs done within 12 months of symptom onset to further reduce the chance that the symptoms prompting the scan were part of PSP.
They compared these pre-symptomatic MRIs to the same patients’ post-onset MRIs and to those of 27 patients with Parkinson’s and another 27 with no known brain disorder. The 27 with PSP all had the classic PSP-Richardson syndrome, where the vertical eye movement problem is more prominent than in the less common PSP subtypes.
I few paragraphs ago, I mentioned that the pons was also measured. In some diseases, both the midbrain and pons atrophy together, but only in PSP is the midbrain affected far worse. So they divided the areas of the pons by that of the midbrain, expecting that ratio to be higher in PSP than in competing diagnostic possibilities.
The results
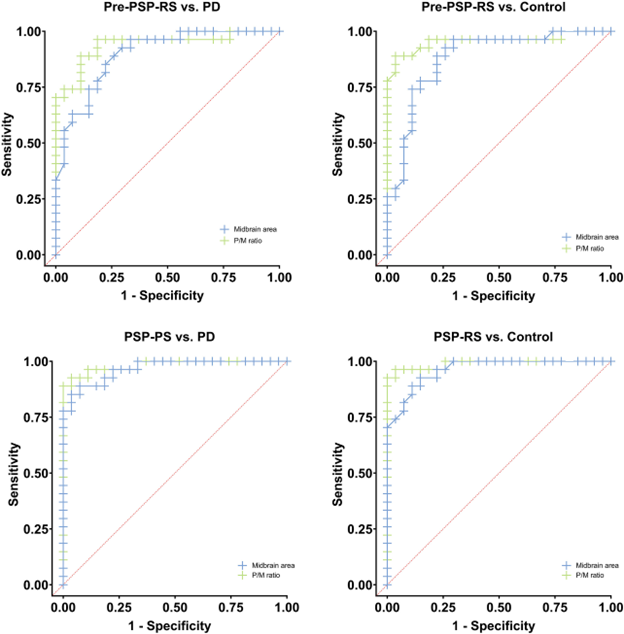
The graph below compares the four subject groups by their pons area, midbrain area and pons/midbrain ratio. There’s some overlap between groups, but the averages (the means) differ both for the midbrain alone and for the pons/midbrain ratio. The horizontal bars with asterisks indicate a statistically significant difference between the means of two groups at the ends of the bar. The pons alone showed no differences, as expected, but the midbrain alone did show a difference and the pons/midbrain ratio did even better than that.
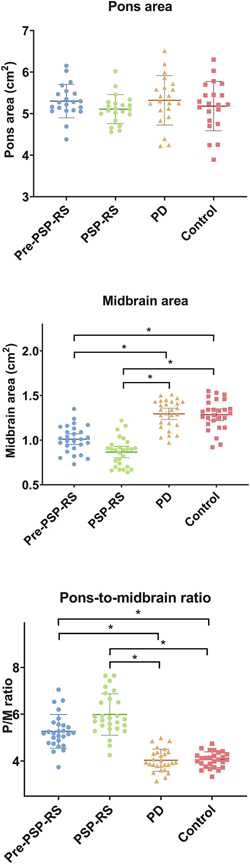
Those differences weren’t just at the level of the group means, which would be scientifically interesting but close to useless for patient care. For the pons/midbrain ratio, the accuracy (the fraction of subjects correctly classified by the test) for pre-symptomatic PSP vs PD was 89% and for pre-symptomatic PSP vs controls, it was 93%. A more critical statistic from the standpoint of avoiding false positives is the specificity, which for the pons/midbrain measurement comparing PSP and PD, was an amazing 100%. It was the same for the PSP vs controls.
Now — for the green eyeshades
A strength of the study is that all the pre-symptomatic MRIs were more than 1 year before symptoms began. Any shorter than that would raise questions of whether very subtle PSP features might have been present. Another strength is that the MRIs were performed on ordinary machines available in any radiology office.
One caveat is that all 27 PSP patients had the PSP-Richardson form, and the findings may not apply to PSP-Parkinsonism or the other atypical forms. Another is that the patients were alive and not autopsy-confirmed in their diagnoses and a third is that the neurological evaluations had been performed by general neurologists rather than by movement disorder specialists.
The take-home
So, we await confirmation by other researchers with larger subject numbers and comparisons of PSP with MSA and DLB. We also need to standardize the measurement of the pons and midbrain areas to strengthen the real-world diagnostic value of this painless, harmless and apparently highly accurate test. Coupling this test with other simple ones may create an even more accurate diagnostic battery.
This could be a keeper. Then all we’ll need is a way to keep everyone pre-symptomatic.
