It’s been a year since I promised you an explanation of the role of “stochastics” in PSP and other neurodegenerative diseases. It goes to the questions I’ve heard from every patient with PSP I’ve ever treated: “Why me?”
The cause of a disease can be boiled down to two components: etiology and pathogenesis. Pathogenesis is about the processes in the body that produce symptoms and tissue loss – the topic of many of my blog posts, but not this one. Etiology is about causative factors originating outside the individual. Here’s a very generic rundown of what’s known about the etiology of PSP:
- Variants in the genetic code inherited from one’s parents:
- 15 gene variants are known to increase the risk of PSP, though each has only a small effect and together they probably explain less than a quarter of the total population’s PSP risk.
- A paper published a few days ago found that a common thread in 13 of the 15 was impairment in the microtubules, the brain cells’ internal monorail/skeletal system. But other commonalities could exist, too.
- Experiences during life, such as:
- Lesser educational attainment is associated with PSP risk.
- Other experiences associated with other neurodegenerative diseases include minor brain injury and non-specific stress.
- Toxic exposures
- Rural living and well water use, each possibly via pesticide exposure.
- Metals, though the specific metals and the routes of exposure remain unclear.
- Foods such as sweetsop, soursop, and American paw-paw, with toxins affecting the mitochondria.
But all these together, based on my seat-of-the-pants statistics, don’t explain most of the population’s risk of developing PSP. Other than genes, experiences and toxins that have eluded detection to date, what other suspects could there be? Stochastic events.
That word basically means “random.” What specific events are happening randomly to cause PSP? A few possibilities:
- Random mutations in one’s DNA occurring during cell division (called “somatic” mutations, as distinguished from “germ line” mutations from mom and dad) may fail to be corrected by the brain’s error-correction machinery.
- Random errors in the encoding of RNA from normal DNA.
- Random changes to the DNA other than the nucleotide sequence (the “letters” in the genetic code) itself. Such changes usually consist of small molecules attached to the DNA and are called “epigenetic” changes. They occur normally as a way to regulate gene function but can also occur inappropriately, with harmful result.
- But the one I’ll put my money on is random tau protein misfolding
Here’s how that works: Normal tau has no standard pattern of folding on itself. Rather, each normal tau molecule is like a piece of overcooked spaghetti in boiling water. But occasionally, and randomly, the loops and curls of one strand happen upon an arrangement that sticks to itself. The brain does have an app for that – a sophisticated mechanism to recognize, tag, and dispose of such miscreants. But some of those abnormal folding patterns have the unfortunate ability to get nearby normal copies of tau to adopt the same abnormal folds. This process, as you’d imagine, operates as a chain reaction, with each misfolded tau molecule inducing the same change in others. The misfolded molecules tend to form stacks, like checkers with interlocking ridges. Those stacks are called fibrils and they’re toxic. Clusters of fibrils are called neurofibrillary tangles.
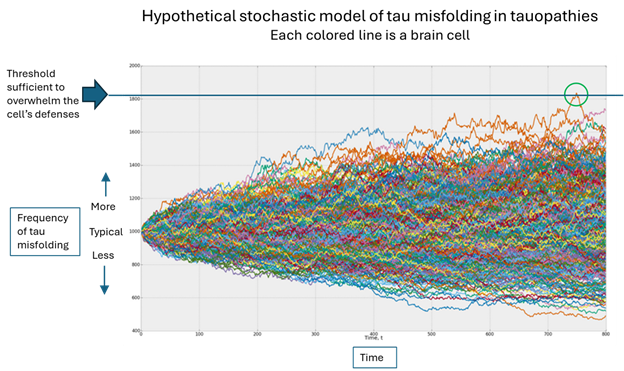
Which brings us to the original question, “Why me”? In the figure below, the horizontal axis is time, the vertical is the population of misfolded tau and each colored line is one brain cell. (The graph was designed by an investment advisory service called Artificall.com to describe the random behavior of stock prices, but the principle is similar. I’ve adapted the graph to present purposes. Ignore the tiny number labels.)
Here’s what’s happening, in my opinion: Each brain cell starts out with the same frequency of tau misfolding events, but then that frequency varies randomly. In the vast majority of cells, the resulting number of misfolded tau molecules stays within the range that the cell’s disposal system can handle. But very rarely, one cell’s load of misfolded tau molecules exceeds that limit (the green circle) and the process of templating more copies can proceed.
Once that one cell on which I’ve placed the green circle has exceeded its ability to dispose of misfolded tau molecules, it can start transmitting them to nearby cells through both synapses and direct contact without synapses. As the cell dies from the toxic effects of all those misfolded tau molecules, it will burst, allowing its misfolded tau molecules to disperse through the brain’s fluid to more distant areas, where the same process occurs.
Where does the “randomness” come in?
Notice that each colored line in the figure varies randomly, its direction of variation at any given point being independent of the movements that got it there. Sooner or later, one brain cell will, by pure chance, accumulate enough random variations in the graph’s upward direction to reach the threshold that overwhelms the cell’s defenses. (Note that an equal number of brain cells are enjoying a less-than-average frequency of tau misfolding – again randomly.)
Where do the other causative factors come in?
Without getting into the weeds, those things damage other cellular functions, perhaps in a very subtle way, but enough to impair the disposal mechanism a bit, thereby slightly lowering that horizontal blue line in the graph, which in turn increases the chances that one brain cell will see its disposal threshold exceeded.
So, what’s the takeaway?
We can’t control the laws of statistics driving the randomness. But we can look at the mechanisms of the known factors that lower the level of that blue line, identify drug targets that neutralize those actions, and design drugs (or repurpose existing molecules) to interfere with them.
So, despite all the energy I’ve put into the genetics and environmental epidemiology of PSP and Parkinson’s over the course of my career, I’ll say this: Maybe it’s time to stop looking for more little contributing causes. Instead, maybe we should devote more of our resources to designing and testing drugs that fit and influence the function of known proteins critical to the processes by which randomly misfolded tau causes damage. AI tools already exist for this purpose and are in active use.
Another approach the problem of low-impact risk factors is to look at them in combination. In theory, they could interact with one another to elevate PSP risk. But that would require either very large patient surveys or sophisticated laboratory models such as stem cells or mice with one or more PSP-related genetic mutations that are then exposed to pesticides or metals, etc.
I’ll keep you apprised before another year passes.
