“Pheno-“ is the Greek root for “outward appearance” and so far, PSP has ten of them. The differences arise from varying emphasis of the degenerative process among different parts of brain. While standard laboratory methods show that at the cellular level the pathology among the ten phenotypes is identical, a few details are starting to emerge using more recent and sophisticated techniques at the molecular level.
The most common PSP phenotype, called PSP-Richardson’s syndrome (PSP-RS), is the one Steele, Richardson and Olszewski originally described in 1964. The others were published piecemeal starting in the early 2000s. J.C. Richardson was the leader of the trio at the University of Toronto, a senior clinical neurologist who noticed an unusual form of Parkinsonism among his patients in the 1950s and 60s. John C. Steele was his trainee and Jerzy Olszewski was the neuropathologist who described the corresponding microscopical abnormalities. So, it’s altogether fitting and proper that Dr. Richardson should be honored in this way.
Prevalence of the phenotypes. The percentage of the PSP population with each phenotype has not been studied in a true community-based population. The published percentages vary widely across centers and are all from referral-based populations at research institutions, where unusual forms of diseases are over-represented to varying degrees. Even without that issue, several things make it hard to be sure of the prevalence of the various phenotypes:
- It’s difficult to estimate the population prevalence of atypical cases of PSP from autopsy series because atypical cases are more likely to come to autopsy, and without autopsy, it’s hard to know that someone with atypical PSP really had PSP.
- In their later years, all of the phenotypes tend to merge into a PSP-RS appearance, so the relative frequencies of the phenotypes may depend on the patients’ disease stage when the researchers evaluated them.
- Clear diagnostic criteria do not yet exist for many of the phenotypes and many patients satisfy criteria for more than one, even in early stages. A method has been published for how to deal with this, but most of the publications antedate or ignore it.
- Although the original differentiation of PSP-RS from PSP-P in 2005 did use a rigorous statistical technique called “factor analysis” to confirm that the two are distinct, this is not usually the case for the other phenotypes relative to PSP-RS or to one another.
Nevertheless, here are my very rough estimates of their contributions to PSP in general, based on a Gestalt impression of the literature:
| Richardson’s syndrome | 45% | PSP-RS |
| Parkinsonism | 25% | PSP-P |
| Frontal | 10% | PSP-F |
| Progressive gait freezing | 5% | PSP-PGF |
| Speech/language | 5% | PSP-SL |
| Corticobasal syndrome | 3% | PSP-CBS |
| Postural instability | 3% | PSP-PI |
| Ocular motor | 3% | PSP-OM |
| Cerebellar | <1% | PSP-C |
| Primary lateral sclerosis | <1% | PSP-PLS |
Many recent research articles group these into three categories based on their anatomical predilections in the brain: cortical vs subcortical. PSP-RS falls into neither of these because it has approximately equal degrees of both cortical and subcortical features. One important, practical reason for the grouping of phenotypes is to have groups large enough for meaningful statistical analysis.
- PSP-RS
- PSP-cortical: PSP-F, PSP-SL, PSP-CBS
- PSP-subcortical: PSP-P, PSP-PGF, PSP-PI, PSP-OM, PSP-C, PSP-PLS
PSP-Parkinsonism. The most common “atypical” (i.e., non-PSP-RS) phenotype of PSP is PSP-Parkinsonism (PSP-P). Relative to PSP-RS, it features more asymmetry, generalized bradykinesia, tremor, and levodopa responsiveness, and only later displays falls and cognitive loss. It is usually initially misdiagnosed as Parkinson’s disease. It has perhaps the slowest course among the PSP phenotypes, averaging about 9 years’ survival from symptom onset. This compares with about 6 years for PSP-RS and intermediate figures for the other phenotypes. In fact, the PSP-subcortical group as a whole has a similarly longer average survival duration than the PSP-cortical group as a whole or the PSP-RS + PSP-cortical groups.
PSP-progressive gait freezing. After PSP-P, the most common atypical phenotype is PSP-progressive gait freezing (PSP-PGF). In fact, most patients exhibiting only progressive gait freezing will eventually develop diagnostic features of PSP. The central feature of PSP-PGF is loss of ability to continue ongoing gait, especially after a pause, during a turn, or at a doorway threshold. In advanced cases, the patient cannot initiate gait at all. The picture also includes rapid, small handwriting and rapid, soft speech as frequent or severe features. The anatomic location of the pathology in such cases differs from that of PSP-RS in showing less involvement of the base of the pons (part of the brainstem) and of the dentate nuclei (part of the cerebellum).
PSP-speech/language. This is a composite category. In PSP-nonfluent/agrammatic variant of primary progressive aphasia (PSP-nfaPPA) speech is halting, with poor grammar, syntax, and pronunciation, but with normal comprehension and naming. A mirror-image variant called semantic-variant primary progressive aphasia (svPPA) features difficulty in naming with reduced vocabulary but with normal grammar and syntax. Together, PSP-svPPA and PSP-nfaPPA are referred to as PSP-speech/language disorder (PSP-SL).
PSP-corticobasal syndrome. CBS as a clinical syndrome (meaning a group of signs and symptoms that occur together, although the underlying disease may differ across patients) comprises highly asymmetric rigidity, slowed movement, and apraxia (loss of skilled movement), often with equally asymmetric dystonia (fixed postures), pyramidal findings (weakness and abnormal reflexes), myoclonus (small, rapid, irregular movements), and cortical sensory signs such as astereognosis (inability to identify objects by feeling them) and agraphesthesia (inability to identify figures traced on the skin). Aphasia (difficulty processing language) and other abnormalities localized to specific brain areas may also occur. Dysarthria (difficulty with pronunciation) can be prominent but gaze palsy, postural instability, and cognitive loss tend to be later and milder than in PSP-RS.
PSP-frontal. More formally called PSP-behavioral variant frontotemporal dementia (PSP-bvFTD or simply PSP-frontal), this phenotype features disinhibition, irritability, apathy, and loss of empathy for others, along with impairment in frontal “executive” functions such as ability to maintain attention, to follow instructions, to shift tasks on command, and to inhibit an ongoing action when appropriate. This is the core of the cognitive and behavioral deficits in PSP-RS, but when it appears first and remains worst, the term PSP-F is appropriate.
PSP-ocular motor and PSP-postural instability. Perhaps unsurprisingly given the cardinal features of PSP-RS, PSP can also take the form of a relatively pure ocular motor picture or a relatively pure picture of severe postural instability with falls and little else to suggest PSP. However, reported cases are very sparse to date. These have been designated PSP-ocular motor (PSP-OM) and PSP-postural instability (PSP-PI).
PSP-primary lateral sclerosis. The pathology of PSP can also produce the clinical picture of primary lateral sclerosis. PLS is one of the phenotypes of amyotrophic lateral sclerosis (ALS; Lou Gehrig disease) and can be difficult to distinguish from it, especially as ALS can produce frontal cognitive difficulties in many cases. The clinical picture of PSP-PLS is highly asymmetric and resembles that of CBS but with little or no cortical sensory loss (spatial sensation ability), dystonia (fixed postures), or myoclonus (very quick, small, irregular involuntary movements).
PSP-cerebellar. The classic lurching gait of PSP-RS has a cerebellar appearance, the speech of PSP has an ataxic (or drunken-sounding) component in many cases, and the ocular square-wave jerks of PSP occur commonly in cerebellar disease. For decades, these were considered minor and inconsistent features, but in 2009, neurologists in Japan described a PSP phenotype of PSP with involvement of the cerebellum at autopsy and early, prominent ataxia of the trunk and limbs. Although that original report found PSP-C in 14% of all people PSP at a Japanese center, the figure is much lower in Western populations for unclear reasons.
A word about drug trial eligibility. Until the cause of PSP in general is better understood, neuroprotection trials — those aimed at the fundamental brain cell loss rather than merely at ameliorating the symptoms — will continue to recruit only patients with PSP-RS. Why?
- We don’t yet know if the non-PSP-RS phenotypes share – either with PSP-PS or with one another — the same molecular abnormality being targeted by the drug.
- While the classic PSP pathology underlies close to 100% of PSP-RS, that figure is much lower for some of the other nine phenotypes. That means that non-PSP-RS may well be a non-PSP pathology, and that admitting participants with non-PSP-RS to a drug study runs a risk that some may not have PSP at all. This could obscure any benefit the drug may have unless the trial is prohibitively large.
- The main outcome measure for nearly all PSP trials is the PSP Rating Scale, which was designed for, has been validated for, PSP-Richardson’s syndrome alone.
- Trials to slow the progression of PSP use the rate of progression as the “outcome variable” of the trial. As noted above, the phenotypes do vary in their expected survival durations, and by inference, their progression rates. Therefore, including phenotypes with different inherent rates of progression would require a larger, longer and more expensive trial. One solution would be to make sure the active drug group and the placebo group receive similar proportions of the various phenotypes (a time-proven technique in trial design called “pseudo-randomization”). But this doesn’t solve the four preceding problems.
- As PSP-RS progresses faster than the other nine phenotypes, a trial enrolling only that phenotype can reach a result in a shorter time or with fewer participants. This isn’t only financially advantageous for the trial’s sponsor. If the drug is ineffective or harmful, fewer patients will have been exposed to it, and if it’s effective and safe, it will reach market approval more quickly.
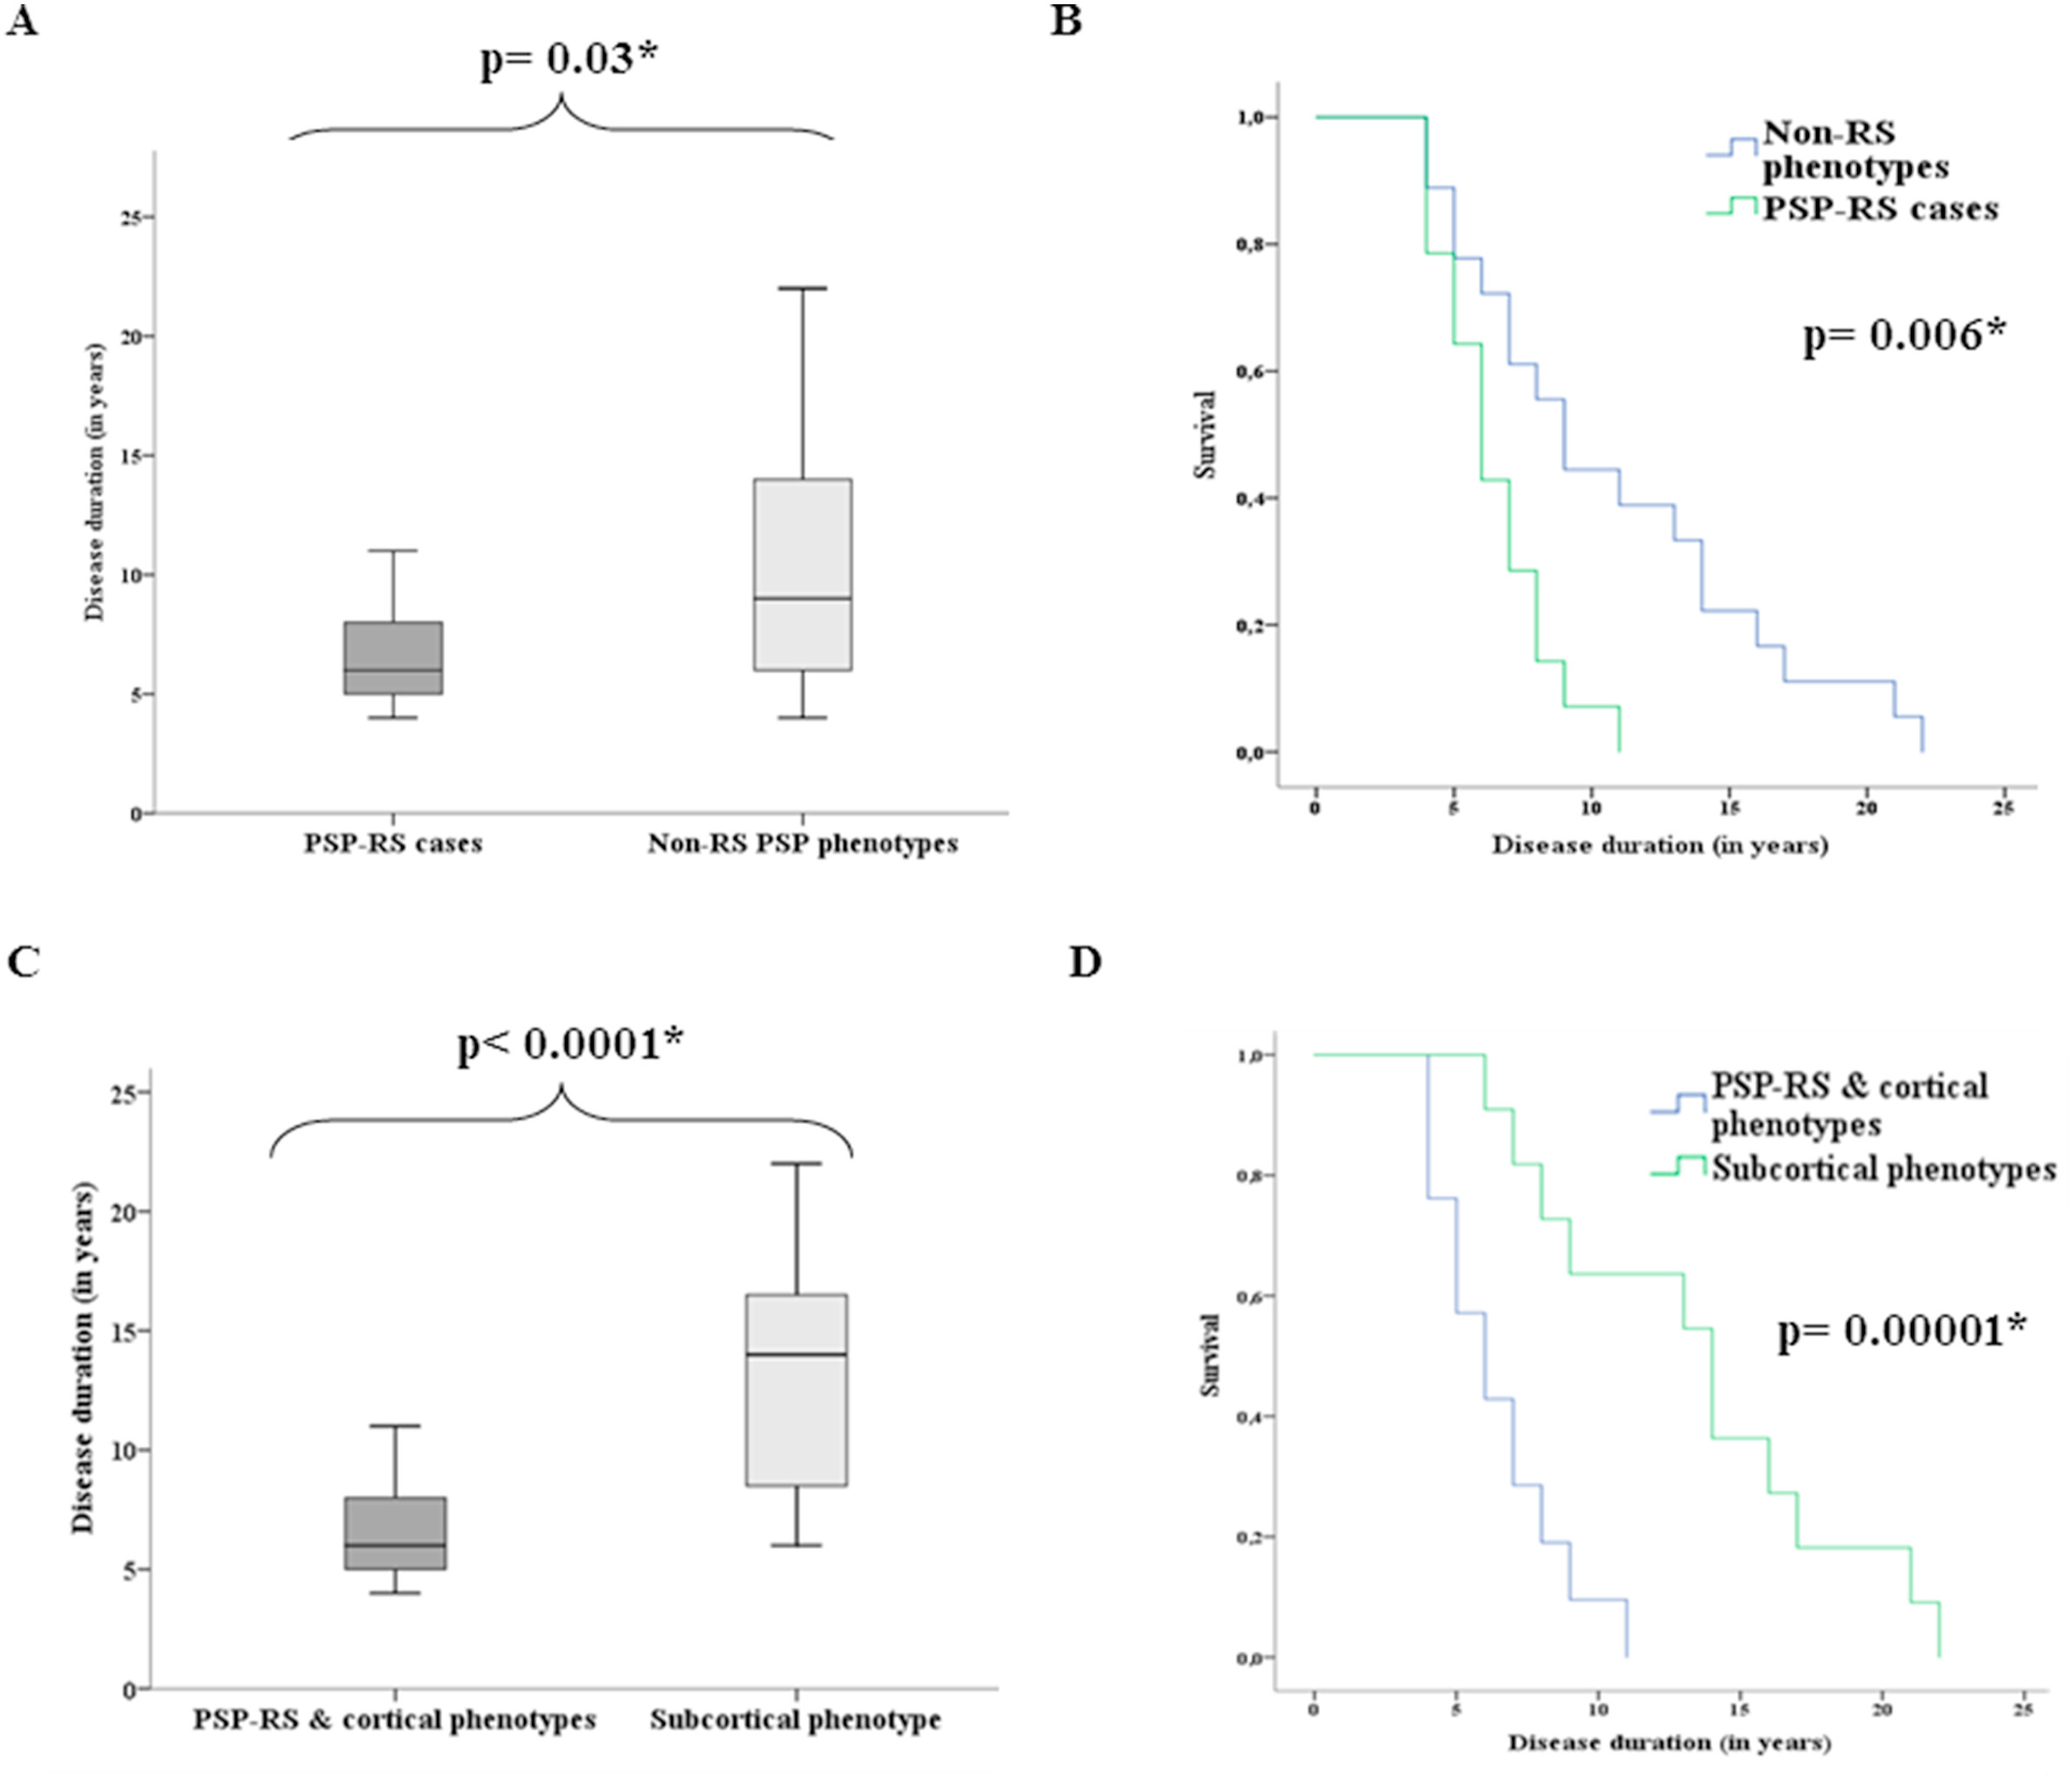
Graphs A and C: For each box, the horizontal line is the median, the upper and lower borders are the 25th and 75th percentiles and the ends of the “whiskers” are the highest and lowest values.
Graphs B and D show the same thing in the form of “survival curves” or “Kaplan-Meier curves.” The vertical axis shows the fraction of the original patients still living at the time (post-onset) shown on the horizontal axis.
The p values are the likelihood that the difference could have happened by random chance. The asterisk indicates that this likelihood is low enough for the difference between the groups to be considered “statistically significant.” (Statistical veterans: Sorry to belabor this for the benefit of the statistical novices.)
To-do list:
- Let’s figure out why the disease spreads through the brain in PSP-RS and the other PSP-cortical phenotypes more quickly than in PSP-subcortical. Efforts to do that have in fact begun and could provide the key to the whole puzzle of PSP.
- Let’s agree on a way to enroll people with non-PSP-RS phenotypes into clinical trials. Current efforts to diagnose PSP using tau-based positron emission tomography (PET) and measures of tau in skin, blood or spinal fluid could potentially identify people with PSP other than PSP-RS who could potentially join a trial.
- Let’s educate neurologists to identify, or at least to suspect, the non-PSP-RS phenotypes. This would allow them to avoid or delay fruitless diagnostic testing and to provide their patients with useful prognostic information.

Dr. Golbe:
Great post! Just to add to the p-value minutia.
I’m glad that researchers still report p-values, because, regardless of their current villification, they’re part of the only kind of statistical analysis that can be relied on. That is they are part of a methodology with error control. Bayesians will jump on your sentence (p values are the likelihood that the difference could have happened by random chance), claiming that you are assigning a posterior probability to the hypothesis that the effect is due to chance—but you’re not*. In my opinion, p-values are best explained starting with those that are NOT small, say larger than .2. If a p-value is not very small, say it’s .3, then a difference even larger than observed could be brought about 30% of the time by random chance alone. So it is not warranted to infer the effect is genuine if it only reaches a p-value of .3. You’d be wrong 30% of the time. By contrast, if the p-value is very small, say .01, 005, then you’d very rarely (i.e., with probability .01 or .005) be wrong in inferring the effect is genuine. If the difference was due to random chance, then, very probably (.99 or .995) a smaller effect would have been observed.
*As you know, strictly speaking, the p-value is the probability of getting as large (or larger) a difference by random chance. But if a p-value is very small, then observing a difference even larger is still small. So what you wrote is OK. Never mind the p-value police.