Yesterday’s post was the first five of my top ten PSP news items of 2025. Here are the rest, again in approximate and subjective descending order of importance.
New ways of interpreting standard MRI images have gained ground as diagnostic markers for PSP. One is a test of iron content in brain cells called “quantitative susceptibility mapping” (QSM). Nine papers on that topic appeared in 2025, four in 2024 and none previously. It’s looking like combining QSM data from ordinary measurements of atrophy of PSP-related brain regions could be the ticket, as both measures come from the same test procedure, unpleasant though it may be, and they measure different things.
Positron emission tomography (PET) imaging of PSP’s type of tau (“4-repeat tau”) has made advances in 2025. This test requires intravenous injection of a “tracer” with a radioactive component that enters the brain tissue,sticks to the target molecule and is then imaged. It can distinguish PSP from non-PSP, distinguish among various PSP subtypes, and quantify the disease progression. The leading such tracer in terms of readiness for submission to the FDA is [18F]PI2620 and a distant second is [18F]APN-1607 ([18F]-PM-PBB3; Florzolotau). A tau PET tracer called Flortaucipir is on the market as a test for Alzheimer’s disease, but it performs poorly for PSP.
There’s brain inflammation in PSP, but it’s not clear whether it’s a cause or a result of the loss of brain cells, or both. Regardless, measuring the quantity and type of inflammation using blood or PET could shed light on the cause of the disease, identify new drug targets, and serve as a diagnostic marker. A good example of 2025 research on blood markers of inflammation in PSP is here and on PET imaging of inflammation is here .
We know of variants in 21 different genes, and counting, each of which subtly influences the risk of developing PSP or its age of onset. The area of the genome most important to PSP is the one that includes the gene encoding tau (called “MAPT”) on chromosome 17. The most important PSP genetic advance in 2025 was probably the discovery that some PSP risk is conferred by extra copies of a stretch of DNA, not the sequence itself. This news could inspire investigation of other places in the genome for other copy-number variants, which are much trickier to find than sequence variants. Here’s a great review of the latest in PSP genetics.
And lastly, a disappointment: a negative result of a double-blind trial of the combination of two drugs already approved for other conditions: sodium phenylbutyrate (“Buphenyl”) and taurursodeoxycholic acid (“TUDCA”). Blog post here.Sponsor’s press release here. Buphenyl protects the endoplasmic reticulum, which helps manufacture proteins, and TUDCA helps prevent brain cells from undergoing self-destruction (“apoptosis”) in response to various kinds of stressors. The pair were theorized to act synergistically. The trial’s upside is that its placebo group data can be used to provide better statistical support for future innovations in clinical trial design.
As I occasionally do, today I’ll create a blog post by combining a reader’s comment on a previous post with my reply. This comment is from Jack Phillips, Chair of the Board of Directors of CurePSP:
Larry, with the more rapidly progressing PSP-PF and its large % of PSP patients, it seems to put even more urgency on our Biomarker Acceleration Program. Do you believe the biomarker program will be able to distinguish between the different subtypes of PSP? Jack
Hi, Jack,
Happy Holidays!
First, let’s assume that further research corroborates the existence, size, and statistical validity of the new subtype called PSP-PF, which isn’t a slam dunk.
You’re right that it would be great to have an accurate way to divide everyone with PSP into a) the two fastest-progressing types (PSP-RS and PSP-PF) and b) all the others. But first, let’s see if that can be done clinically (i.e., using good old history and neuro exam). Now that many of the people with the more aggressive variations of PSP-F and PSP-PI can be grouped as PSP-PF, the remaining, slower-progressing cases of PSP-F and PSP-PI would probably be easier to distinguish from PSP-RS than they were before, so maybe clinical would work well.
As for the ability of CurePSP’s pending biomarker program to do this job better than simple clinical evaluation: The first thing that comes to mind is to image the anatomical location(s) of the most intense tau deposition and/or inflammation in the brain. Second-generation tau PET using the tracers 18F-PI-2620 or 18F-APN-1607 can already do those things to an extent. That technique would now have to be refined and tested for its ability to identify PSP-PF.
So, yes, a PET marker to diagnose PSP-PF (or maybe a PSP-PF/PSP-RS group) is a realistic goal in the next couple of years. But the multi-million-dollar expense of all those experimental PET scans together with the administrative costs would be better handled by the companies making the PET ligands than by a relatively small nonprofit like CurePSP.
As a more affordable alternative to PET, markers of neurodegeneration intensity might be able to distinguish PSP-RS/PSP-PF from the more slowly-progressing PSP types. Measures of atrophy on ordinary MRI (conditioned on symptom duration at the time of the test) might be able to do this to an extent, as might serum levels of neurofilament light chain or inflammation-related compounds.
Perhaps an index combining those two with clinical history and exam could be the ticket. (Or perhaps all those tests would only succeed in identifying the same group of patients, in which case combining them would be pointless. But that would be good to know.) Now, that’s something that the CurePSP Biomarker Initiative could afford to fund.
We still don’t have a great diagnostic test for PSP. The best we can do is about 80%-90% sensitivity, specificity and positive predictive value. In English:
Sensitivity is the fraction of people with PSP who give a positive result on the test.
Specificity is the fraction of people without PSP who give a negative result on the test.
Positive predictive value is the fraction of people with a positive test who actually have PSP.
A single number combining these into something useful in evaluating a single individual — rather than in comparing groups — is the “area under the receiver operating curve” (AUC; see this post for an explanation). The AUC ranges from 0.50, which is no better than a coin toss, to 1.00, which is perfect accuracy. An acceptable diagnostic test typically has an AUC of at least 0.85.
Most of the studies of PSP diagnostic markers have important weaknesses such as:
The studies frequently set up artificial situations such as distinguishing PSP only from PD or normal aging rather than from the long list of other possibilities that must be considered in the real world.
The patients’ “true diagnoses” are usually defined by history and examination alone rather than by autopsy.
The patients included in the study were already known to have PSP by history and exam (or sometimes by autopsy), while the purpose of the marker would be to identify PSP in its much earlier, equivocal stages or in borderline or atypical cases.
The patients with PSP in most such studies are only those with PSP-Richardson’s syndrome, who account for only about half of all PSP in the real world.
The best type of marker so far is ordinary MRI. Recently, a group of neurologists in Athens, Greece led by first author Dr. Vasilios C. Constantinides and senior author Dr. Leonidas Stefanis evaluated the specificity of various MRI-based measurements of brain atrophy. One strength of their study was that their 441 subjects included people not only with PSP and Parkinson’s disease, but also with a long list of other conditions with which PSP is sometimes confused as well as a group of healthy age-matched controls.
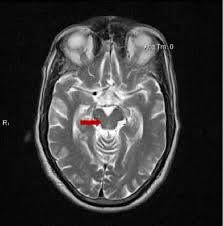
The single best MRI marker per this study was the area of the midbrain, the fat, V-shaped structure indicated below:
They found that MRI markers provided:
High diagnostic value (AUC >0.950 and/or sensitivity and specificity ∼90 %) to distinguish PSP from multiple system atrophy, Parkinson’s disease, and control groups.
Intermediate diagnostic value (AUC 0.900 to 0.950 and/or sensitivity and specificity 80 % to 90 %) to distinguish PSP from Alzheimer’s disease, frontotemporal dementia, dementia with Lewy bodies, and mild cognitive impairment (an early stage usually of AD).
Insufficient diagnostic value (AUC < 0.900 or sensitivity/specificity ∼80 %) to distinguish PSP from corticobasal degeneration, normal-pressure hydrocephalus, and primary progressive aphasia (a language abnormality that can be caused by multiple specific diseases).
Insufficient value to distinguish the non-Richardson PSP subtypes from corticobasal degeneration and primary progressive aphasia, but good performance in the other comparators.
The researchers also concluded that:
One MRI measurement isn’t best for all the possible PSP comparators.
Sometimes a combination of two or three measurements performed better than any single measurement.
One weakness of their method was the use of subjects diagnosed by standard history/exam (i.e., “clinical”) criteria, rather than by autopsy. Another is that their patients with PSP had had symptoms for an average of three years, so these were not subtle or early-stage cases. A letter to the journal’s editor from Dr. Bing Chen of Qingdao City, China further pointed out that the study of Constantinides and colleagues failed to account for the subtle effects of neurological medications on brain atrophy. As PSP and the comparator disorders may be treated with different sets of drugs, taking this factor into account might enhance or reduce the apparent diagnostic value of MRI atrophy measurements.
So, bottom line? Drs. Constantinides and colleagues have given us the first study of MRI markers in PSP to include meaningful numbers of subjects with non-Richardson subtypes. It’s also one of the few studies of any kind of PSP marker to include comparison of PSP a wide range of diagnostic “competitors” beyond just Parkinson’s and healthy aged persons. Another plus is that the test, routine MRI, is nearly universally available, relatively inexpensive, and non-invasive.
The hope is that Pharma companies or others with candidate drugs will now have fewer or lower hurdles in the way of initiating clinical trials.
The cerebellum is gradually being understood as a contributor to cognitive and behavioral function in both in health and disease. A new publication has teased out MRI changes in the cerebellum that differentiate PSP from other dementing disorders early in the disease. This pattern could be developed into a diagnostic test and as a marker of disease progression and even as a guide to rehabilitation measures.
The cerebellum is classically thought of as a regulator of movement. In its most simplistic essence, its job is to put a brake on voluntary movement instructions from the cerebrum. The cerebellum is guided in this task by perception of the position and motion of the trunk, head and limbs, by the effect of gravity, all complemented by visual input.
More recently, the cerebellum has demonstrated a memory function when it comes to movement regulation (making “muscle memory” more than just a metaphorical expression), and damage to certain parts of the cerebellum can cause a behavior disinhibition and cognitive impulsivity similar to the frontal lobe damage seen in PSP. In that sense, the cerebellum still functions as a “brake,” but on behavior and cognition rather than just on movement.
Now, researchers from the University of California San Francisco have carefully analyzed routine MRI scans from people with dementia arising from a variety of neurodegenerative conditions including PSP. They specifically quantified gray matter damage. (Gray matter is brain tissue composed mostly of cell bodies — as opposed to white matter, which is mostly axons. In the cerebellum, unlike the cerebrum, the gray matter is the deeper layer and the white matter is superficial.)
The figure below shows the principal results. Illustration from Chen Y, et al. Alzheimer’s & Dementia, 2023. The senior author is Dr. Katherine Rankin. Each MRI image has been reconstructed by computer from routine scans to show the cerebellum splayed out flat. The randomly assigned colored areas represent a loss of gray matter relative to non-demented people of similar age (“Controls”). Note that the pattern for PSP differs in obvious ways from the other diseases, though at present the differences are only between the averages for groups, not individual differences useful for diagnosis in routine care.
Notes: The small type abbreviations are the sub-areas of the cerebellum. AD=Alzheimer’s disease; CBD=corticobasal degeneration; LBD=Lewy body dementia; TDP=frontotemporal dementia with TDP-43 protein aggregation. It comes in 3 types. “Pick’s” is a form of frontotemporal dementia. LBD is combined with AD because at autopsy, the former is always accompanied by some of the latter. This paper did not include Parkinson’s disease or multiple system atrophy, as those diseases rarely include dementia early in the course, the focus of the present study.
The authors conclude, “These findings suggest the potential for cerebellar neuroimaging as a non-invasive biomarker for differential diagnosis and monitoring.” They hasten to add that to understand the reasons for these different patterns of cerebellar loss, future studies will have to image the areas of the cerebrum where brain cell activity has been lost and to correlate that with corresponding loss of activity in the cerebellum. That’s called “functional neuroimaging” as opposed to the “structural neuroimaging” of the current study.
These insights, aside from their qualitative and quantitative diagnostic value, could provide guidance for electrical or magnetic transcranial stimulation (i.e., delivered across the scalp and skull rather than by inserting hardware onto or into the brain) as symptomatic treatment for PSP and the other dementing disorders.
Here are two more research presentations from the Movement Disorders Society conference in Copenhagen back in August. These, both pretty technical (sorry!), report on imaging techniques elucidating how the brain is mis-firing in PSP. Both of them offer ideas for new treatment approaches.
Localizing a brain network of progressive supranuclear palsy
E. Ellis, J. Morrison-Ham, E. Younger, J. Joutsa, D. Corp (Melbourne, Australia)
A brain network is a set of areas in the brain that have direct connections with one another and work together to perform a task. When a neurodegenerative disease like PSP occurs, an important way for the abnormality to spread through the brain is along such networks. That produces areas of brain cell loss (“atrophy”) in a specific pattern for a specific disease. These researchers pointed out that in some people with PSP, the “textbook” list of brain areas showing such loss on conventional MRI imaging is not present. They hypothesize that the usual brain network may nevertheless be abnormal, but without producing enough actual brain cell loss to show up as the full, textbook pattern. So, they analyzed a database of MRI, PET, and SPECT scans of 363 people with PSP and tabulated the areas of abnormality. They compared that list to a database of known brain networks that had been compiled using functional MRI in 1,000 healthy people. (Functional MRI is a standard research technique where a movement or thinking task is performed or a certain sensory input is provided to a person in an MRI machine. The image is obtained in such a way as to reveal which brain areas’ baseline activity increase or decrease together in response.) They found a consistent brain network to be affected in people with PSP, even if conventional imaging fails to show it. The claustrum, basal ganglia, and midbrain increase their activity, and the cuneus and precuneus reduce theirs. The authors conclude that their findings “help to reconcile previous heterogeneous neuroimaging findings by demonstrating that they are part of a common brain network.”
This information could be useful in designing non-invasive, transcranial electrical or magnetic stimulation treatment for PSP. If the absence (or mildness) of brain cell loss in some patients with PSP means that those cells are still only malfunctioning rather than dying, it could have important implications for development of treatments aimed at rescuing such cells before the damage becomes irreversible.
Topography of cholinergic vulnerability correlates of PIGD motor deficits in DLB and PSP: A [18F]-FEOBV PET study
P. Kanel, T. Brown, S. Roytman, J. Barr, C C. Spears, N. Bohnen (Ann Arbor, USA)
Neurotransmitters are chemicals used by brain and nerve cells to signal to one another across synapses. Any given brain cell (or related cluster of brain cells, called a “nucleus”) uses a single neurotransmitter type. One of the more commonly used neurotransmitters in the brain is acetylcholine, and neurons using it are among the most important to become damaged in PSP. These researchers imaged the brains of patients with PSP using a positron emission tomography (PET) imaging technique that shows acetylcholinergic synaptic activity. They compared the abnormal areas in each patient to their degree of balance difficulty and gait problems. They found correlations in basal forebrain, septal nucleus, medial temporal lobe, insula, metathalamus, caudate, cingulum, frontal lobe, cerebellum, and tectum, especially the superior colliculus. They found that the first areas on this daunting list, the basal forebrain, where the basal nucleus of Meynert is located, is hit hardest and connects to most of the other areas on the list. They conclude that treatment strategies attempting to replace or regenerate damaged neurons for PSP might want to start there.
It’s been known for decades that the basal nucleus of Meynert is heavily involved in PSP and Alzheimer’s disease, but attempts to compensate for the loss of acetylcholine by inhibiting an enzyme that degrades it (using marketed oral medications such as rivastigmine, donepezil, or galantamine) have produced only minimal results. Perhaps a targeted, surgical approach to regenerating basal nucleus of Meynert neurons using gene therapy could work better.
A very active area of research right now is how various imaging techniques (“scans” in English) can and cannot assist in distinguishing the atypical Parkinsonian disorders from other conditions and from one another. Yes, this is important for clinical care and counseling. But even more important right now is that until we have specific treatments for these diseases, we need accurate diagnosis in living people. This is important for laboratory researchers who want to know the true diagnosis of the patient who supplied a fluid sample, and to the designers of clinical trials who want to make sure the patients in their trials have the disease for which the treatment was designed.
Dr. Jennifer L. Whitwell, a radiology researcher at the Mayo Clinic in Rochester, MN has just published a very helpful review of that topic in Current Opinion in Neurology. It gets pretty technical, but here are the takeaways with, of course, my own editorial contributions:
Measurement of atrophy by MRI:
The magnetic resonance Parkinsonism index (MRPI), especially its updated version, the MRPI 2.0, gives excellent differentiation of PSP from non-PSP, with an area under the receiver operating curve of 0.98. (That statistic is 1.00 for perfect accuracy and 0.50 for no better than a flip of a coin. For a bit more explanation of the AUROC and a graph, see this post from last year.)
Routine MRI can also be used to compare the various PSP variants with regard to atrophy of specific brain structures. Atrophy of the brainstem is worse in PSP-Richardson syndrome, PSP-CBS and PSP-frontal than in the others. This information could be useful in treatment trial design because some PSP variants progress faster than others. So, a trial of a disease-slowing treatment could potentially determine which patients have which variants and adjust the statistical analysis of the treatment outcomes accordingly.
MRI shows that atrophy in PSP-Richardson’s syndrome starts in the midbrain, (the upper part of the brainstem where the substantia nigra and the vertical gaze centers reside), followed by a succession of other areas of the brainstem, cerebellum and basal ganglia, before finally reaching the cerebral cortex. But two PSP subtypes involving relatively more cortical function (the frontal behavioral type and the corticobasal syndrome type) spread into the frontal cortex much earlier in the process, although like PSP-RS, they start in the midbrain. These observations could help guide designers of other imaging-based diagnostic tests for PSP.
Measurement of metabolism by fluorodeoxyglucose positron emission tomography (FDG PET): The pattern of reduced brain tissue metabolic activity in PSP can be distinguished from normal with an AUROC of 0.99. Distinguishing PSP from corticobasal syndrome, multiple system atrophy and Parkinson’s disease is more difficult but still useful at 0.90.
Measurement of tau deposition by PET: A PET technique that reveals the location of abnormal tau in Alzheimer’s is already in standard clinical use for AD, but it doesn’t work well for other tauopathies. Two techniques designed for PSP are expected to enter pivotal clinical trials in the next few months. In small studies, the two ligands called PI-2620 and APN-1607 (formerly called PM-PBB3) have shown good results in distinguishing PSP from the other tau disorders and Parkinsonian disorders. (A PET ligand is the chemical injected intravenously that sticks to the brain chemical of interest, allowing its location to be mapped.) But these two ligands can occasionally give conflicting results when given to the same patient, so the AUROCs from the upcoming trials are eagerly awaited.
Measurement of iron deposition by MRI: This technique, called quantitative susceptibility mapping (QSM), is not part of a routine MRI, but it can be performed with the same machine. Its PSP-diagnostic results are not quite as accurate of the ones above, with an AUROC of 0.83 for distinguishing PSP-Richardson’s syndrome from Parkinson’s disease. I assume the AUROCs for other kinds of PSP, especially PSP-Parkinsonism, are worse, but work continues on this technique.
Functional MRI: The spread through the brain of abnormal tau, and with it the damage of PSP, proceeds along “functional networks.” That means that after first affecting the substantia nigra in the midbrain, the damage proceeds to areas most closely yoked to it in terms of simultaneous electrical activity. Those physiological relationships have been delineated by “functional MRI” technique, where a person is given various mental or motor tasks to perform while in the MRI machine. The MRI software is set to measure not physical or chemical structure as for routine MRI, but blood flow, which correlates exquisitely with brain tissue electrical activity. These observations could potentially allow researchers to assess the effects of experimental drugs on the immediate or longer-term pattern of brain cell activation in people with PSP.
Exciting developments all, and I apologize for nerding out on you yet again. But as one of this blog’s commenters said a few years ago, “Thanks, Dr. Golbe, for respecting our intelligence.” Still, I’ll try softer stuff next time.
Two full weeks since my last post – holiday activities, don’t you know, starting on December 21 with a solstice party at the home of an eccentric friend. I see that my blog viewership has declined precipitously in the past week, so I’m happy that you all have better things to do at holiday time than to read about PSP. Don’t we all wish that the disease itself would take a few days off, too?
My re-emergent thought is about the famous “hummingbird sign.” On an MRI scan in the sagittal plane – that’s as if you sliced someone down the middle and looked at the cut surface – the brainstem sort of looks like a side view of a hummingbird.
In the MRIs above, the nose is on the left. In the lower images, the arrows stop just short of the indicated structures so as not to obscure them. Note the progressively thinner, sleeker midbrain (the hummingbird’s head and beak) with retention of the plump pons (the belly, which is plumper than than that of a real hummingbird).
Now here’s the issue. The appearance of the hummingbird sign isn’t as closely related to PSP as has been implied by many. There are just too many false positives and false negatives.
The false positives mostly occur in people with normal-pressure hydrocephalus, a condition where the fluid-filled spaces in the brain (the “ventricles”) enlarge because of an obstruction in the re-absorption of the fluid into the bloodstream. This stretches the fibers adjacent to the ventricles, impairing control of gait, cognition and the bladder. It also presses down on the midbrain, producing the hummingbird sign. Then there are those individuals with corticobasal degeneration where the features resemble PSP (“CBS-PSP”). They can also have a hummingbird sign.
The false negatives occur in the first couple of years after the initial symptoms. They also occur if the MRI is mis-aligned on the brain or the head is a little rotated, producing an allegedly midline cut that’s actually a couple of millimeters to one side. That means that the thinnest part of the midbrain, which is in the midline, isn’t shown in the image.
You should also know that the hummingbird sign isn’t just about a thin midbrain. A normal pons is also part of the sign. That’s because in multiple system atrophy and a few rarer disorders, both the midbrain and pons become thinner. But in PSP, it’s mostly the midbrain that does so.
I think that in the next year or two, a test of the tau protein in spinal fluid, blood or a tiny punch biopsy of skin will provide a much more accurate diagnosis of PSP than the hummingbird sign. Soon thereafter we will probably have a PET technique that does the same. Then, clinical treatment trials can be accomplished faster because they won’t have to compensate for the statistical noise produced by participants with a false positive diagnosis. In fact, all sorts of research on PSP will become much more powerful if people without PSP can be excluded.
You may have noticed that I’ve been bullish on the ability of ordinary MRI scans to help diagnose PSP. Now there’s an on-line, automated resource to allow anyone anywhere to upload MRI images and receive an answer – for free.
We’ve known for over a decade that very careful, standardized measurement of the size of various parts of the brain can track the progression of PSP over the 1-year course of treatment trial better than the PSP Rating Scale or any other “bedside” measure. But more recently, MRI has been found to be highly useful in the differential diagnosis of PSP – that is, telling PSP from normal aging, Parkinson’s, Alzheimer’s, and other conditions.
For an excellent, technical, open-access review of simple MRI measurements in the diagnosis of PSP, click here. The leading authors are Dr. Aldo Quattrone and his son Dr. Andrea Quattrone at Universita Magna Graecia in Catanzaro, Italy, who pioneered most of the discoveries described.
Such MRI-based measurements use only routinely obtained images like those from your local radiologist. But actually doing the measurements requires some experience. The Catanzaro group has created a Web portal onto which anyone can upload de-identified MRI images from a CD. An answer returns in a few days. The site is https://mrpi.unicz.it/.
The black-and-white images below show the inputs into the automated algorithm. Sorry if these close-up brain images look like abstract expressionism. The drawings here may help orient you.
MRI images A and B are sagittal (A is in the midline and B is a few mm to one side), images C and D are in the coronal plane and image E is in the horizontal (or axial) plane.
from: Quattrone, et al. Brain Science, 2022.
A: midbrain area (upper outline; Amb) and pons area (lower outline; Apons) (In PSP, atrophy of the midbrain is marked but atrophy of the pons is mild.)
B: middle cerebellar peduncle diameter (This atrophies only a little in PSP.)
C: superior cerebellar peduncle diameter in a slice parallel to the midline (“parasagittal” slice; This atrophies moderately in PSP.)
D: third ventricle diameter (averaging the diameters of the front, middle and back thirds) (This enlarges markedly in PSP.)
E: maximum distance between anterior horns of lateral ventricles (This atrophies moderately in PSP.)
The number derived from these measurements is called the magnetic resonance parkinsonism index (MRPI). Its value is (Apons/Amb) x (B/C). Values above 13.88 indicate PSP-RS with 89% sensitivity*, 95% specificity* and 94% accuracy*. This works best in separating PSP-Richardson syndrome from Parkinson’s disease.
The MRPI 2.0 is (MRPI) x (D/E). This works better than the original MRPI in separating PSP-Parkinson and other non-Richardson PSP variants from Parkinson’s disease. Values above 2.70 indicate PSP with 86% sensitivity, 92% specificity and 90% accuracy.
*Sensitivity is the fraction of people with the disease who have a positive test.
Specificity is the fraction of people without the disease who have a negative test.
Accuracy is the fraction of people with an accurate test, whether positive or negative.
In this case, “the disease” means PSP and “without the disease” means PD, some other disease or no disease.
The really valuable part is that this technique works well even in early, mild cases, where a diagnosis could not be made by other means. In a few studies, such patients were followed for years until they showed more definitive signs, which were then used to validate the initial, image-based diagnoses.
This technique has not been shown effective in differentiating PSP-P from multiple system atrophy of the parkinsonian type (MSA-P), which is a common dilemma for movement disorder specialists seeing a patient with mild symptoms. But the MRPI and MRPI 2.0 could be combined with other supplementary tests such as supine and standing blood pressure (usually abnormal in MSA-P, normal in PSP) and still-experimental tests such as blood levels of tau, phosphorylated tau and neurofilament light chain (all elevated in PSP, not in MSA) to refine its abilities.
Another important caveat: Sometimes PSP can be mimicked by rare cases of common diseases like Alzheimer’s or dementia with Lewy bodies, or by some rare diseases like corticobasal degeneration, frontotemporal dementia with parkinsonism, or pallidopontonigral degeneration. There haven’t yet been enough patients with those things subjected to the MRPI or MRPI 2.0 to prove those formulas able to separate those conditions from PSP. After all, the MRI only looks for atrophy of certain brain structures, regardless of whether that atrophy is related to tau aggregation or something else.
Bottom line: As my medical students don’t appreciate hearing, no diagnostic test short of autopsy is ever going to be definitive on its own. Any test will have to be combined with old-fashioned history and exam and with other imaging, fluids or physiological tests. Knowing which of those to choose for a given patient and how to interpret the results will keep humble, human neuro-diagnosticians in business for a while longer.
—–
In my next post: another on-line tool for the diagnosis of PSP.
A 2019 article I came across this week dragged me back into blog posting after a month-long break (sorry, fans — I have no excuse). I remember seeing the paper at the time but blew it off as mere confirmation of previous publications. But it actually may provide a way to diagnose PSP years before symptoms appear.
The problem is a familiar one
As you know from my constant harping on the subject, what we really need are two things: a way to diagnose PSP in its earliest stages, preferably before it causes any disabling symptoms (or any symptoms at all); and a way to prevent the disease process from progressing further than that. In official lingo: a marker and neuroprotection.
All sorts of marker proposals are showing promise: leading the pack right now are tests of blood or spinal fluid for neurofilament light chain or tau, PET scans for tau, and various MRI techniques. Two of the more distant contenders are smartphone-based eye movement measurements and skin biopsies for tau aggregates. The problem is to differentiate very early PSP from normal aging and from competing diagnostic possibilities such as Parkinson’s, MSA and dementia with Lewy bodies.
Get out your rulers
MRI measurements of the volume of the cerebrum is a very sensitive way to track the progression of PSP and is used in drug trials routinely to compare the rate of brain loss in the treatment group to that in the placebo group. But it doesn’t work for diagnosing the disease in the first place. For that, you need to image a part of the brain that, unlike the cerebrum, is involved early in the course of the disease. It also has to be easy to image using standard MRI machines. The dorsal midbrain does both.
As an internal comparator, the study also measured the size of the pons, which is the segment of brainstem just below the midbrain. It atrophies little in PSP. For both measures, they used the area in square centimeters of the structure on a mid-sagittal MRI cut (one that slices the head perfectly into left and right halves). See the image below.
MRI in the mid-sagittal plane, with nose at left of each. The left image shows the dorsal midbrain and the right, the pons. a radiologist drew the outlines by hand with a mouse. The MRI machine’s software calculates the area with each outline in square centimeters. (From Cui et al BMC Neurology 2020)
Now, while the dorsal midbrain is where vertical eye movement, the hallmark of PSP, is situated, it’s not where PSP starts. That happens in subthalamic nucleus, the globus pallidus and the substantia nigra. But the dorsal midbrain gets involved soon enough, is much easier to image than those things, and is consistently involved in the classic form of PSP, Richardson syndrome.
History is not bunk
So, with that as background, Dr. Jong Hyeon Ahn and colleagues from six university hospitals in South Korea found 27 patients with PSP with brain MRIs not only after their PSP symptoms began, but also before they began. The scans had been performed for non-PSP symptoms such as transient dizziness, fainting, suspected stroke, or headache. In fact, the article says that elderly South Koreans often request — and receive — brain MRIs as part of their routine checkups. (Who knew?) The MRIs were routine, with none of the standardization across radiology sites that are commonplace in multi-center drug studies. In other words, these were “real world” MRIs.
The pre-symptomatic MRIs were performed an average of 28 months (range: 12-48 months) before PSP symptoms began and the researchers pored over their records to make sure there were no symptoms at the time suggestive of PSP. They rejected MRIs done within 12 months of symptom onset to further reduce the chance that the symptoms prompting the scan were part of PSP.
They compared these pre-symptomatic MRIs to the same patients’ post-onset MRIs and to those of 27 patients with Parkinson’s and another 27 with no known brain disorder. The 27 with PSP all had the classic PSP-Richardson syndrome, where the vertical eye movement problem is more prominent than in the less common PSP subtypes.
I few paragraphs ago, I mentioned that the pons was also measured. In some diseases, both the midbrain and pons atrophy together, but only in PSP is the midbrain affected far worse. So they divided the areas of the pons by that of the midbrain, expecting that ratio to be higher in PSP than in competing diagnostic possibilities.
The results
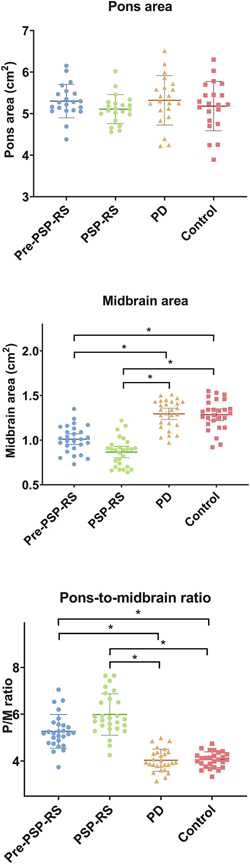
The graph below compares the four subject groups by their pons area, midbrain area and pons/midbrain ratio. There’s some overlap between groups, but the averages (the means) differ both for the midbrain alone and for the pons/midbrain ratio. The horizontal bars with asterisks indicate a statistically significant difference between the means of two groups at the ends of the bar. The pons alone showed no differences, as expected, but the midbrain alone did show a difference and the pons/midbrain ratio did even better than that.
Areas of dorsal midbrain and pons as measured on mid-sagittal MRI. The horizontal brackets with asterisks indicate statistically significant differences between groups. P=pons, M=midbrain, RS=Richardson’s syndrome, PD=Parkinson’s disease (from Ahn et al Park Rel Dis 2022)
Those differences weren’t just at the level of the group means, which would be scientifically interesting but close to useless for patient care. For the pons/midbrain ratio, the accuracy (the fraction of subjects correctly classified by the test) for pre-symptomatic PSP vs PD was 89% and for pre-symptomatic PSP vs controls, it was 93%. A more critical statistic from the standpoint of avoiding false positives is the specificity, which for the pons/midbrain measurement comparing PSP and PD, was an amazing 100%. It was the same for the PSP vs controls.
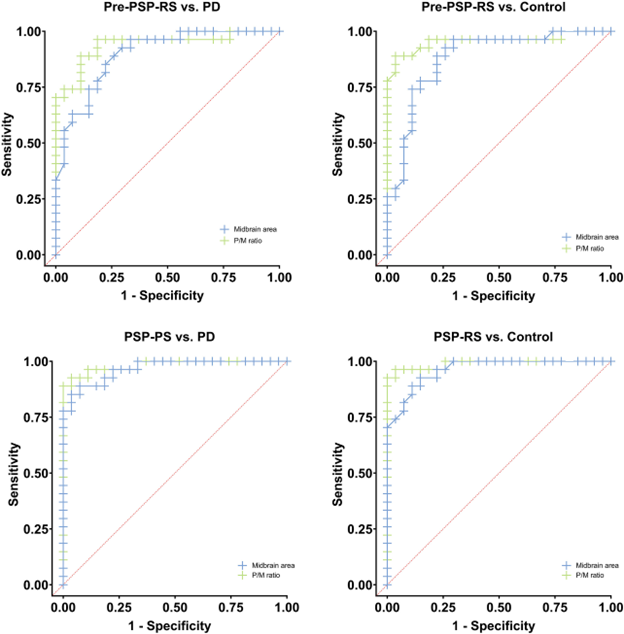
Receiver operating curves showing the trade-off between the sensitivity and specificity of the midbrain area (blue) with pons/midbrain ratio (green) in distinguishing patients with PSP from those with Parkinson’s disease (left two graphs) or controls (right two graphs). The two upper graphs compare pre-symptomatic PSP with PD or controls. The two bottom scans compare post-onset PSP with PD or controls. (From Ahn et al. Park Rel Disord 2022)
Now — for the green eyeshades
A strength of the study is that all the pre-symptomatic MRIs were more than 1 year before symptoms began. Any shorter than that would raise questions of whether very subtle PSP features might have been present. Another strength is that the MRIs were performed on ordinary machines available in any radiology office.
One caveat is that all 27 PSP patients had the PSP-Richardson form, and the findings may not apply to PSP-Parkinsonism or the other atypical forms. Another is that the patients were alive and not autopsy-confirmed in their diagnoses and a third is that the neurological evaluations had been performed by general neurologists rather than by movement disorder specialists.
The take-home
So, we await confirmation by other researchers with larger subject numbers and comparisons of PSP with MSA and DLB. We also need to standardize the measurement of the pons and midbrain areas to strengthen the real-world diagnostic value of this painless, harmless and apparently highly accurate test. Coupling this test with other simple ones may create an even more accurate diagnostic battery.
This could be a keeper. Then all we’ll need is a way to keep everyone pre-symptomatic.
Everyone with a suspected diagnosis of PSP should have a brain MRI. It can find more-readily-treated things such as strokes, tumors or normal-pressure hydrocephalus. But the MRI is not all that useful in differentiating PSP in its early, diagnostically-uncertain, stages from other neurodegenerative conditions such as Parkinson’s, MSA, Alzheimer’s, CBD, dementia with Lewy bodies, and the several forms of FTD. Even the famous hummingbird sign of PSP doesn’t appear until the middle stages of the disease, by which time a neurologist can make the diagnosis by history and physical exam anyway. Besides, any disorder that causes atrophy of the midbrain will produce a hummingbird sign.
But now, researchers at the University of California, San Francisco and the Universitat Autònoma de Barcelona have used an automated system to measure the degree of atrophy of several areas of brain as seen on MRI. The system, called “FreeSurfer,” is in standard use in research requiring MRI measurements. The lead author was Ignacio Illán-Gaia and the senior author was Adam Boxer. All of their 326 subjects had been evaluated at UCSF’s Memory and Aging Center between 1994 and 2019. The diagnosis in each case was later established at autopsy – a major scientific strength of this study. Autopsy showed PSP in 68, CBD in 44, various forms of FTD in 144, Alzheimer’s in 45, and PD, MSA or DLB in only 11.
The four brain areas chosen for analysis were all previously known to atrophy in PSP: cerebral cortex, midbrain, pons and superior cerebellar peduncle. (The midbrain and pons are in the brainstem and the SCP is one of three tracts connecting the cerebellum to the rest of the brain.) They used not only the size of each, but also a previously reported index called the “magnetic resonance parkinsonism index” (MRPI), a formula involving the size of the midbrain, pons, SCP and middle cerebellar peduncle. (See note below for details.) The MRPI does very well in distinguishing PSP from PD, but has not been adequately evaluated against all possible alternative diagnoses. Actually, an updated version called “MRPI 2.0” can distinguish PSP from MSA because it takes into account atrophy of the thalamus, but it’s too new to have an automated version, so this project satisfied itself with the MRPI.
The result was that the MRPI showed an excellent ability to distinguish PSP from the other diseases as a group. The area under the receiver operating curve (AUROC; see my previous post for an explanation) was excellent: 0.90 of a possible 1.00. But the AUROC for distinguishing PSP from CBD was only moderate at 0.83. A more sophisticated statistical analysis, a “multiple logistic regression model” (MLRM), worked even better, distinguishing PSP from the others with a superb AUROC of 0.98. The CBD- vs-others comparison also benefited from the MLRM, rising to 0.86.
To put the AUROC into more-relatable terms: The AUROC of 0.98 in this case corresponds to an “accuracy” of 95%. That means that the MLRM got the diagnosis correct (i.e., PSP or not PSP) in 95% of patients. But that simple calculation can be misleading, which is why the AUROC is used by researchers.
As mentioned above, the total number of patients with PD, DLB and MSA was only 11. That’s because the study was performed at a memory center, not a movement center. While the MRPI has proven its utility in distinguishing PSP from PD, the same can’t be said for the PSP vs DLB or the PSP vs MSA comparisons. So we need more work with a statistically robust number of patients with DLB and MSA.
For an admittedly biased assessment of the importance of this study, here’s Dr. Illán-Gaia in emailed comments in response to my request for a couple of quotable blurbs:
Our study demonstrates in a large autopsy-proven cohort that combining a set of cortical and subcortical measures of cerebral atrophy could represent a powerful diagnostic tool. These measures can be obtained with a simple MRI and could be combined with other biomarkers to improve the diagnosis of patients with PSP or CBD.
More work needs to be done to ensure the translation of our method to clinical practice and we are now working to validate our results in other large multicenter studies.
Notes:
The MRPI is calculated as follows: (area of pons on mid-sagittal section / area of midbrain on midsagittal section) X (diameter of middle cerebellar peduncle on parasagittal section / diameter of superior cerebellar peduncle on coronal section).
The MRPI 2.0 multiplies the MRPI by the (maximum width of the third ventricle / maximum width of the frontal horns of the lateral ventricles).